Contents
Previous
Next
From version 1.2 JpGraph supports drawing of anti-aliased lines. There
are a few caveats in order to use this which is discussed in this
section.
Sidebar Note that anti-aliasing will not
be used for either horizontal, vertical or 45 degree lines since they
are by their nature are sampled at adequate rate.
Anti-aliased lines are enabled by calling the method
SetAntiAliasing() in the Image
class in the script where you want to use anti-aliasing.
The anti-aliasing for lines works by "smoothing" out the edges on
the line by using a progressive scale of colors interpolated between
the background color and the line color.
Sidenote: The algorithm used for
anti-aliasing of lines is quite simple. It would be possible to achieve
even better result by doing some real 2D signal processing. However,
doing real time 2D signal processing on a HTTP server would be madness
so I deliberately kept it simple. To achieve best visual result always
use a dark line color on a light background.
An example will show that this, quite simple algorithm, gives a
reasonable good result. The figures below shows a radar plot with and
without anti-aliasing.
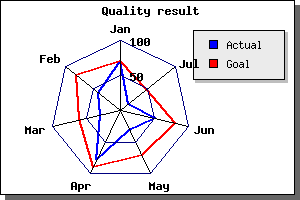 Figure 1: Spiderplot without anti-aliasing
[src]
Figure 1: Spiderplot without anti-aliasing
[src]
|
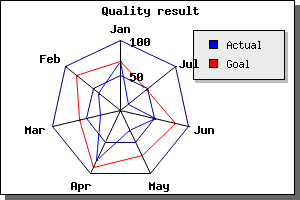 Figure 2: Spiderplot with anti-aliasing
[src]
Figure 2: Spiderplot with anti-aliasing
[src]
|
One thing you need to keep in mind when deciding to use
anti-aliasing is that it could have potentially a dramatic effect on
the time it takes to generate the image. Line drawing with
anti-aliasing turned on is roughly 8 times slower than the normal line
drawing so treat this feature wisely.
Furthermore there are a couple of "gotchas" you should be aware of
when using anti-aliasing.
- Anti-aliased lines uses up more of the available color-palette. The
exact number of colors used is dependent on the line-angle, a near
horizontal or near vertical line uses more colors (number of lines with
different angles uses more colors). Hence it might not be possible to
use anti-aliasing with color-gradient fill since the number of
available colors in the palette might not be enough. A normal palette
can keep around 256 colors. This means that you are advised to use a
true-color image when using anti-aliasing.
- Anti-aliasing does not work very well together with background
images since it assumes a the same solid color on each side of the
line. Doing a more advanced anti-aliasing algorithm would simple take
to much processing power.
- Anti-aliased lines will ignore the line width specified. They will
always have a width of roughly 1.
JpGraph provide the possibility for you to rotate the generated graph
an arbitrary angle. This will only affect the actual graph (axis, axis
titles, labels and so on) and not fixed elements on the graph like
title or footer.
Rotation is probably most used to rotate a graph 90 degrees, for
example a bar graph to get the effect of horizontal bars.
Performance note: Adding a rotation
transformation will make the graph generation slightly slower since
each point of the graph as to go through a transformation step before
being stroked on to the image. JpGraph optimizes this by using a
pre-calculated transformation matric and also optimizes the special
case 90 degrees.
By default the center of the rotation will be the center of the plot
area, which may or may not coincide with the center of the entire
image.
To control the rotation you use the two methods
For example
$graph->image->SetAngle(45);
There is actually a third method that you could use, adding a
translation to the graph after the rotation. Since
this probably a very little used method we don't discuss it further but
refer the reader to the class reference instead
Graph:image::SetTranslation()
When you rotate an image you should be aware of that the individual
labels on the axis are not rotated. The design decision behind this is
a) Bit mapped font can't be rotated
b) Maintain readability
Please remember that you may still rotate the labels by calling the Axis::SetLabelAngle()
method.
Since the anchor point for labels is by default the optimum for
graph at 0 degree you might want to adjust the anchor point and
alignment for the labels on the axis to get a better visual appearance
on you rotated graph. This is accomplished by the method
Axis::SetLabelAlign() For a detailed discussion on how to do this
please see the section on horizontal bar graphs, (
Working with bar plots )
The table below shows some examples on different kinds of rotation
to give you an idea of how changing the angle and rotation center may
be used to generate different effects. The top left graph is the
original image. The point of rotation has been marked with a red-cross
in each of the images.
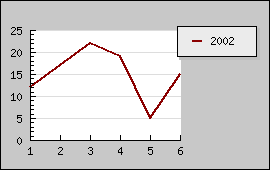 Figure 3: Original image
[src]
Figure 3: Original image
[src]
|
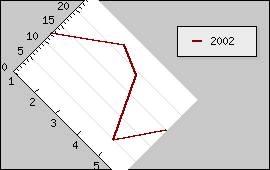 Figure 4: Rotated 45 degrees around center of plot
area [src]
Figure 4: Rotated 45 degrees around center of plot
area [src]
|
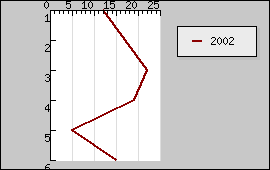 Figure 5: Rotated 90 degrees around center of plot
area [src]
Figure 5: Rotated 90 degrees around center of plot
area [src]
|
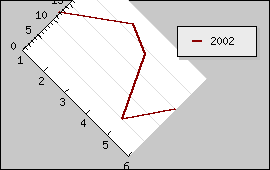 Figure 6: Rotated 45 degrees around center of the
image [src]
Figure 6: Rotated 45 degrees around center of the
image [src]
|
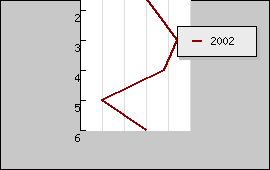 Figure 7: Rotated 90 degrees around center of the
image [src]
Figure 7: Rotated 90 degrees around center of the
image [src]
|
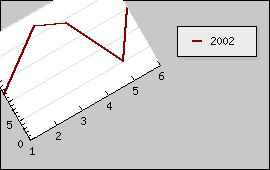 Figure 8: Rotated -30 degrees around the lower
left point of the plot area [src]
Figure 8: Rotated -30 degrees around the lower
left point of the plot area [src]
|
As you can see from the images above if you rotate about any other
point than the center of the plot area the plot can be placed outside
the image after rotation.
Since the rotation, by design, only affects the plot area it is
often most effective to use when the color of the margin is the same as
the background color.
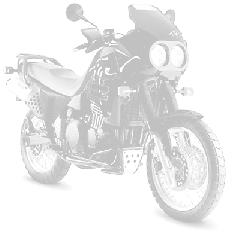
The following section only applies to palette images. This
means it wont work on true-color images. It is often desirable
to have a background image look a little bit "washed" out so it doesn't
take the concentration away from the actual graph. There are basically
two ways of accomplish this
- Prepare the image with an external images editor to adjust the
level of brightness and contrasty to a desirable level
- Use JpGraph:s built in adjustment for contrast, brightness and
color saturation.
To adjust the background image call The levels for both brightness and
contrast are real numbers in the range [-1, 1] You can choose to adjust
for example just the background image or you might also choose to
adjust the whole image. To change the background image just use the
method
Graph::AdjBackgroundImage() to specify a suitable value. Let's show
some example on what we can do with this. The following example have
been generated by using the small utility "adjimg.php" which you can
find in the "utils/" directory.
Brightness=0, contrast=0, saturation = -1 (Original image) | 
Brightness=0, contrast=0, saturation = -1 (Black &White image) |
Brightness=0.3, contrast=-0.3, saturation=0 | 
Brightness=0.4, contrast=-0.7, saturation=0 |
Brightness=0.4, contrast=-0.7, saturation=-1 | 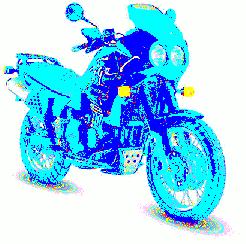
Brightness=0, contrast=0, saturation=1 |
During development and optimization it can be very handy to have the
actual time it took to generate the image as a footnote. The following
example shows the usage of this feature
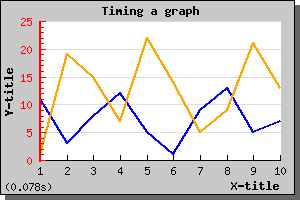 Figure 9: Timing of a graph
[src]
Figure 9: Timing of a graph
[src]
To enable this feature you can proceed in two ways.
- You can either set the global define BRAND_TIMING (in jpgraph.php)
to true. This will add the timing string to all graphs generated.
- .. or you can enable it for a specific graph by setting the global
variable $gJpgBrandTiming as in
$gJpgBrandTiming=true;
in the beginning of the script.
If you like you might also change the way the timing is formatted by
setting the string defined by BRAND_TIMING_FORMAT (in jpgraph.php).
This string represents a standard printf() format string.
Sidenote: JpGraph contains a utility class
called JpgTimer which you can use yourself should you need ms timing of
part of your own code. The API is really simple. The class supports
multiple running timers and you start a timer simply by calling the
Push() method. This will start a new timer and put it on the top of the
timer stack. To stop the timer, pop it from the stack and return the
timing value simply call Pop().
JpGraph has built-in support for over 200 country flags, i.e. they are
available to be used in graphs without any external image definitions.
Country flags can be used in primarily two settings
- As image markers in line and scatter graphs
- As background images for graphs
- As a special type of icons (using the IconPlot()) which can be
added to the graph in any arbitrary position. See next section
In order to make it easy to find the appropriate country flags they can
be specified with either full or partial name or as an numeric index.
The routines in JpGraph are "smart" enough to figure out which way you
are trying to specify a particular flag.
To specify a country flag as a marker you have to specify the
special mark type as one of MARK_FLAG1,MARK_FLAG2,MARK_FLAG3 or
MARK_FLAG4
Flags are internally stored in 4 different sizes which is indicated
by the number in the mark types. Flags may also be arbitrary scaled
when displayed. Since this is partially overlapping functionality you
might very well ask why the flags are stored in four different basic
sizes. The reason is of course performance. It you only want a very
small flag it takes processing time to scale down a large image to,
say, a small icon size. At the same time for large flags to be used as
background a small original flag might not have enough details to be
scaled up to a large size. Hence the reason for storing the flags in 4
different sizes.
The example below shows how to use country flags as markers
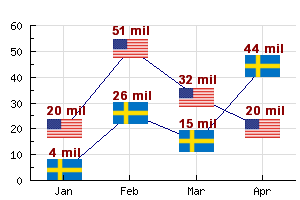 Figure 10: Using country flags as line plot
markers [src]
Figure 10: Using country flags as line plot
markers [src]
To use country flags as background one has to use the method
Graph::SetBackgroundCountryFlag(). With this method you can specify
both how much of the image should be filled as well as how much of the
flag should be mixed into the background.
To see a list of all supported country flags you can run the script
"listallcountryflags.php" in the Example directory. This will show you
a table with all flags.
In addition to the standard background image you can also add an
arbitrary number of icons onto the background of the graph. These icons
are created with a call to the special Plot class IconPlot.
The image from icons are taken from a file or as one of the builtin
country flags.
You may control how much of the icon should be blended into the
background by specifying a percentage (1-100). The example below shows
how to mix in the picture of "Tux" into the background of a filled line
graph. Note: This example uses alpha blending and will therefore
require GD2.
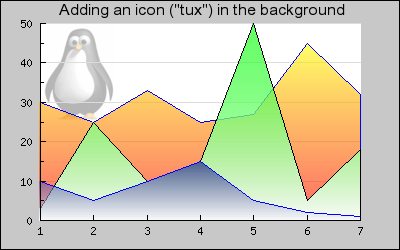 Figure 11: Adding an icon into the background
[src]
Figure 11: Adding an icon into the background
[src]
To specify any of the roughly 200 country flags as an icon you first
create an empty Icon and then call the IconPlot::SetCountryFlag() with
the appropriate parameters. (See the class reference). This is
illustrated below by adding the Icelandic flag into the background as
an icon
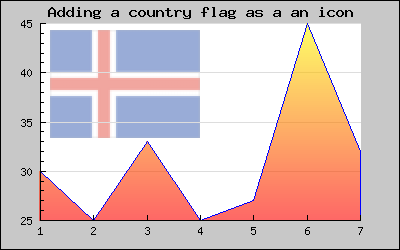 Figure 12: Adding an icon flag into the background [src]
Note:Some "older" versions of PHP pre-4.3.3 using the
builtin GD have problems rendering blended images. If you have this
problem then you need to upgrade to a more modern version of PHP.
Contents
Previous
Next