Figure 1: Example of what you can draw on a canvas [src]
Working with canvas requires more understanding of JpGraph as well as more programming and fine tuning.
You can work with a canvas in different levels of complexity. You can for example work directly with the Image class which provides a large number of primitives for drawing but requires that you use absolute pixel coordinates.
You can also make life a little bit easier by using a canvas scale. This lets you define your own scale on the canvas which often makes it easier by letting you work on a grid you have specified yourself. It also makes it very easy to re-scale you image automatically by just changing your scale. For example to half the size of you drawing you just make the scale twice as large.
To give you some help in working with different canvas you should include the "jpgraph_canvtools.php" file when working on canvases. This is not strictly necessary but it will give you some nice abstraction to help you create your masterpieces.
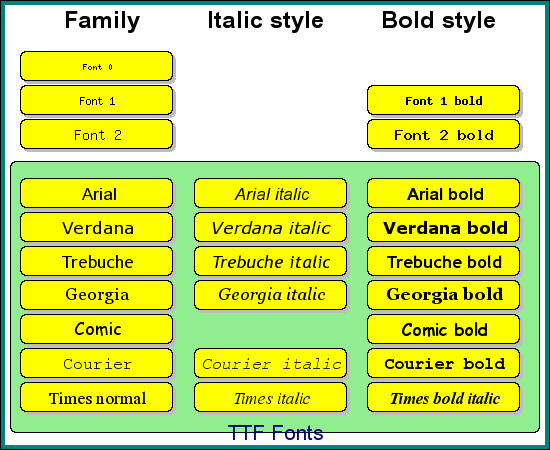
As another (concrete) example on the use of a canvas the figure below is a listing of font styles available with JpGraph.
Creating a canvas gives you the opportunity draw arbitrary shapes on a "white" piece of paper. Let's first show a simple example were we just draw a text box. We first show you the code which we will walk through
 <?php

// $Id: canvasex01.php,v 1.3
 2002/10/23 08:17:23 aditus Exp $

include
 "../jpgraph.php";

include "../jpgraph_canvas.php";


// Setup a basic canvas we can work

 $g =
 new CanvasGraph
(400,300,
'auto');

$g->SetMargin(
5,11,6
,11);

$g->SetShadow();

$g->SetMarginColor(
"teal");


// We need to stroke the plotarea and
 margin before we add the

// text since we otherwise would overwrite the text.

$g->InitFrame();


// Draw a text box in the middle

$txt="This\nis\na TEXT!!!";

$t = new Text(
$txt,200,10
);

$t->SetFont(
FF_ARIAL,
FS_BOLD,40);


// How should the text box interpret
 the coordinates?

$t->Align(
'center','top');


// How should the paragraph be
 aligned?

$t->ParagraphAlign(
'center');


// Add a box around the text, white
 fill, black border and gray shadow

$t->SetBox(
"white",
"black","gray");


// Stroke the text

$t->Stroke(
$g->img);


// Stroke the graph

$g->Stroke();


?>
We then call the InitFrame() method which actually strokes the margin and plotarea to the graph. Since everything is stroked in the order you issue the commands you must make sure that the graphical objects you want on top is stroked last. This is different from the way you normally work with JpGraph since it queues up all you addition and then makes sure they are stroked in the correct order.
We then create a Text object, setup it's properties, including the absolute screen position where we want the text, and then stroke it. Her it might be a need for a closer explanation of the, perhaps misnamed, method Text::Align() This method states how the text coordinates should be interpreted , i.e when we specify (200,10) as the coordinates for the text paragraph should that be interpreted as the top left corner, bottom-left corner or something else (of the bounding box)? In the code above we have chosen to interpret the X-coordinate as being the center of the bounding box and the Y-coordinate as the top. Hence the text will be aligned so that the (200,100) point in the graph is aligned with the middle of the top line of the paragraphs bounding box.
We also specify that the lines within the paragraph should be centered with a call to Text::ParagraphAlign() Since we also choose to have a box around the text we have to make use of the method Text::SetBox() which is used to specify the fill color, the border color and the shadow color (if you leave out shadow color or set it to '', no shadow will be used).
Now we are ready to stroke the text onto the canvas. In order to do so we must specify the basic Image drawing class we want to use. Without discussing this further we just state that a suitable image class can always be found as the img property of the Graph class.
Finally we are ready to stroke the entire graph, which in effect sends the canvas back to the browser. Below you can see the effect of all this code
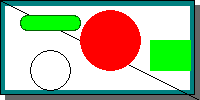
$graph->img->Line(0,0,100,100);
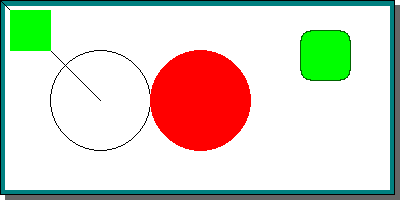
To your code. The following example shows some of the graphic primitives you have access to in the Image class
 <?php

// $Id: canvasex02.php,v 1.1
 2002/08/27 20:08:57 aditus Exp $

include
 "../jpgraph.php";

include "../jpgraph_canvas.php";


// Setup a basic canvas we can work

 $g =
 new CanvasGraph
(400,200,
'auto');

$g->SetMargin(
5,11,6
,11);

$g->SetShadow();

$g->SetMarginColor(
"teal");


// We need to stroke the plotarea and
 margin before we add the

// text since we otherwise would overwrite the text.

$g->InitFrame();


// Add a black line

$g->img->
SetColor(
'black');

$g->img->
Line(0,0
,100,100);


// .. and a circle (x,y,diameter)

$g->img->
Circle(100,100
,50);


// .. and a filled circle
 (x,y,diameter)

$g->img->
SetColor('red');

$g->img->
FilledCircle(
200,100,50
);


// .. add a rectangle

$g->img->
SetColor(
'green');

$g->img->
FilledRectangle(
10,10,50
,50);


// .. add a filled rounded rectangle

$g->img->
SetColor(
'green');

$g->img->
FilledRoundedRectangle(
300,30,350
,80,10);

// .. with a darker border

$g->img->
SetColor(
'darkgreen');

$g->img->
RoundedRectangle(
300,30,350
,80,10);


// Stroke the graph

$g->Stroke();


?>
We refer you to the class reference to find out what other graphic primitives are available for use.
To help with this you can use a scale for the canvas. This lets you define a "work-space" of your choice. You can for example set the coordinates to be between X:0-10, Y:0-10. This makes it easier to position objects on the canvas. This also has two additional advantages:
To use this type of scaling you must make sure you include the file "jpgraph_canvtools.php" . In addition to the scaling class their are also a couple of other utility classes that may come in handy, especially the Shape class.
Using the scale is quite simple. You first instantiate a scale
object passing the graph as a parameter and then specify the scale you
want to use. This means you need to add the lines
 $scale = new CanvasScale($g);

$scale->Set(0,$xmax,0,$ymax);
to your code. You can then use one of the translation methods (for
example
CanvasScale::Translate()) in the canvas scale class to translate
between your world coordinates and the absolute screen coordinates.
This means you could take the code in the example above and just add
the lines, for example,
 list($x1,$y1) =
 $this->scale->Translate($x1,$y1);

list($x2,$y2) = $this->scale->Translate($x2,$y2);

$g->img->Line($x1,$y1,$x2,$y2);
Since this pattern has to be repeated for every object that has to be drawn it makes good sense to encapsulate this in a separate class. This is exactly why the canvas tools file also have a utility class called Shape This class is mainly a wrapper around the most commonly used methods in the basic Image class (with one important exception) and does all these the translation for you. Please see the class reference for a complete list of the available methods To set up the Shape class you instantiate it with the graphic context and the scale you want to use as argument as in
$shape = new Shape($g,$scale);
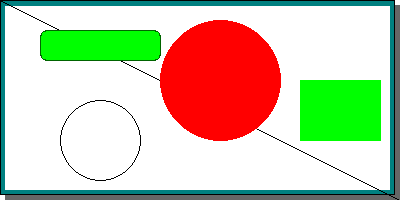
You are then ready to use all the methods in the shape class. Using a scale and imitating the previous example we would get the source shown below.
 <?php

// $Id: canvasex03.php,v 1.1
 2002/08/27 20:08:57 aditus Exp $

include
 "../jpgraph.php";

include "../jpgraph_canvas.php";

include "../jpgraph_canvtools.php";


// Define work space

$xmax=20;

$ymax=20;


// Setup a basic canvas we can work

 $g =
 new CanvasGraph
(400,200,
'auto');

$g->SetMargin(
5,11,6
,11);

$g->SetShadow();

$g->SetMarginColor(
"teal");


// We need to stroke the plotarea and
 margin before we add the

// text since we otherwise would overwrite the text.

$g->InitFrame();


// Create a new scale

$scale =
 new CanvasScale
($g);

$scale->Set(
0,$xmax,0
,$ymax);


// The shape class is wrapper around
 the Imgae class which translates

// the coordinates for us

$shape =
 new Shape($g,
$scale);

$shape->SetColor(
'black');


// Add a black line

$shape->SetColor(
'black');

$shape->Line(
0,0,20
,20);


// .. and a circle (x,y,diameter)

$shape->Circle(
5,14,2
);


// .. and a filled circle
 (x,y,diameter)

$shape->SetColor(
'red');

$shape->FilledCircle(
11,8,3
);


// .. add a rectangle

$shape->SetColor(
'green');

$shape->FilledRectangle(15,
8,19,14
);


// .. add a filled rounded rectangle

$shape->SetColor(
'green');

$shape->FilledRoundedRectangle(2,
3,8,6
);

// .. with a darker border

$shape->SetColor(
'darkgreen');

$shape->RoundedRectangle(2,
3,8,6
);


// Stroke the graph

$g->Stroke();


?>
If we like to make a smaller image we could just change the image size and everything will be rescaled without any further code changes. SO for example making the image half the size would give the result
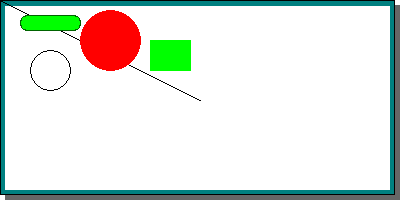
If we instead wanted to keep the image size but shrink the shapes we could just make the scale twice as large which would result in
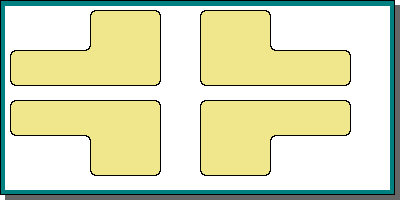
We previously mentioned that the Shape class was a wrapper around the image class with one exception. So what is the exception? Well, glad you asked. The exception is that it contain an additional method which draws an "indented rectangle". An indented rectangle is a rectangle where one of it's four corners have been moved into the rectangle. You create an indented rectangle by calling either Shape::IndentedRectangle() or A few examples illustrates what this shape looks like.
As a final note we mention the class CanvasRectangleText Which can be used to add a text with a rounded rectangle (possibly filled) onto the canvas. The previous example where all the available fonts were drawn were using this class. We don't describe it further but refer the interested reader to the class reference and the 'listfontsex1.php' example file.
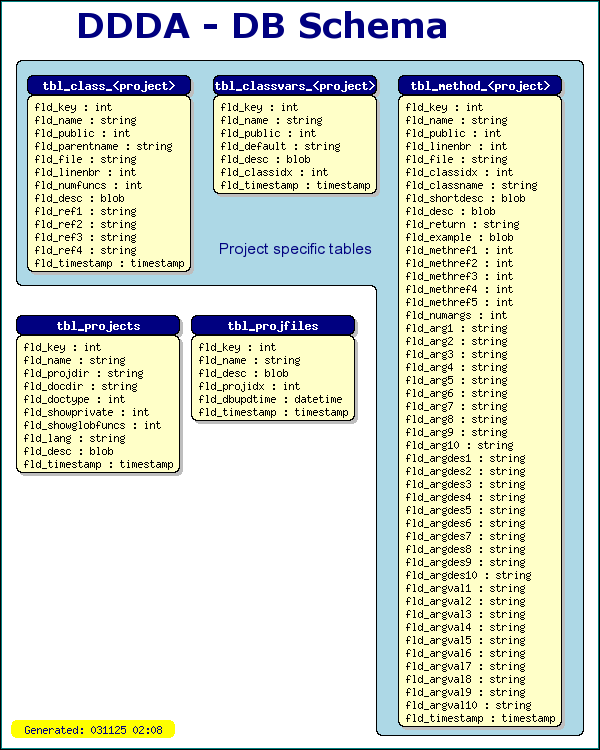
The library php file "utils/misc/imgdbschema.php" included in the distribution contains some utility classes to make the drawing of table schemes easier. It contains two basic classes, Class ImgDBTable and Class ImgDBSchema. The first class understand how to draw an image illustrating a single table. The second class is responsible for automatically extract all the relevant information from a DB to draw a complete DB Schema.
Before going into this a little bit more we show what an example of this might look like.
Before going on it should be noted that the ImgDBSchema assumes that the DB can be accessed through a DB abstraction layer modeled after the abstraction layer available in the 'jpdb.php' file in the DDDA architecture. This abstraction layer assumes a MySQL database in the bottom. This specific dependency of this particular abstraction layer is the reason I have not included these classes in the generic canvas tools file.
The second thing you should note that this library does not contain a complete automatic-layout engine but rather a very simple automatic system which, if nothing else is specified, just puts the table in a rectangular grid. A complete graph layout engine would simple be to much to write in this context. This is also a very difficult optimization problem and sofar not even any of the professional programs I have seen that tries this can achieve a satisfactory layout without manual intervention.
The critical lines in the code to generate the above graph is
 $tblposadj=array($tlo,0,$tblwidth+$tlo+2,0,2*$tblwidth+$tlo+4,0,-1,16,-1,16);

$dbschema = new
 ImgDBSchema("jpgraph_doc","FormatTblName","FormatFldName");

$dbschema->SetMargin($leftm,$topm);

$dbschema->SetTableWidth($tblwidth);

$dbschema->Stroke($this->img,$this->iscale,$tblposadj);
The rest of the code in the file is just to setup the canvas, add an indented rectangle to group some tables and generate a footer with the date and time this image was generated.
The first line instantiates a new ImgDBSCheme layout engine asking it to draw an image for the database 'jpgraph_doc'. The following two arguments specify two callback functions for formatting the text for header and each field in a table.
The next line specify the top left margin where the drawing of the tables should be started.
The third line specify the width of a single table. The final lines starts the engine and draws all tables in the database to the canvas. The final argument requires some further explanation. This is an offset (x,y) from the top left corner how each individual table should be positioned. If the value is -1 indicates that the default value should be used. If this array is not specified then the tables will simple arranged line by line.
The full source code for drawing this DB schema example is shown below.
 <?php


/*=======================================================================

// File:     DBSCHEMAEX1.PHP

// Description:    Draw a DB schema of the DDDA architecture

// Created:     2002-08-25

// Author:    Johan Persson (johanp@aditus.nu)

// Ver:        $Id: dbschemaex1.php,v 1.1 2002/08/27 20:08:57
 aditus Exp $

//

// License:     This code is released under QPL

//              Copyright (C) 2001,2002 Johan Persson

// Note:        The actual drawing of the tables are
 semi-automatically

//              but you can easily adjust the individual tables
 position

//              with the 'tblposadj' array.

 //


//========================================================================

*/

include
 "../jpgraph.php";

include "../jpgraph_canvas.php";

include "../jpgraph_canvtools.php";

include
 "../utils/misc/imgdbschema.inc";

include "../utils/jpdocgen/jpdb.php";


// Global callback to format the
 table header names

function
 FormatTblName(
$aName) {

    // We want to replace any specifi
 references to the

    // 'JpGraph' project with the generic '<project>'

    return
 str_replace(
'JpGraph',
'<project>',
 $aName);

}


// Global callback to format each
 field name in the table

function
 FormatFldName(
$aName,$aTable) {

    return $aName
;

}


class Driver
 {


    var $ig
, $img, $iscale,
 $ishape;

    var $iymax
,$ixmax;

    var $iwidth
,$iheight;


    function Driver
() {


    // Define Image size and
 coordinate grid space to work within

    $this
->iwidth = 600;

    $this
->iheight= 750;

    $this
->iymax  = 50;

    $this
->ixmax  = 55;


    // Setup a basic canvas

    $this
->ig = new CanvasGraph(
$this->iwidth,$this
->iheight,'auto');

    $this
->img = $this->
ig->img;


    // Define the scale to be used

    $this
->iscale = new CanvasScale(
$this->ig);

    $this
->iscale->Set(
0,$this->ixmax
,0,$this->
iymax);

    $this
->ishape = new Shape(
$this->ig,$this
->iscale);


    // A small frame around the
 canvas

    $this
->ig->SetMargin(
2,3,2
,3);

    $this
->ig->SetMarginColor(
"teal");

    $this
->ig->InitFrame();


    }


    function Run
() {


    $leftm
=1.5;    // Left margin (for table schemes)

     $topm
=5;    // Top margin (for table schemes)

     $tblwidth
=15;    // Individual table width

    $tlo
=1;        // Offset for top line


    // Add the background color for the project specific tables

    $this
->ishape->IndentedRectangle($leftm,
$topm-1,3
*$tblwidth+$tlo+
6,45,

                     $tlo
+2*$tblwidth+
2,30,CORNER_BOTTOMLEFT,

                     'lightblue');


    // Stroke the tables (series of
 x,y offsets, If =-1 then use the

    // automtic positioning

    $tblposadj
=array($tlo,0,
$tblwidth+$tlo+2
,0,2*
$tblwidth+$tlo+4
,

             0
,-1,16,-
1,16);

    $dbschema
 = new ImgDBSchema
('jpgraph_doc'
,'FormatTblName'
,'FormatFldName'
);

    $dbschema
->SetMargin($leftm,
$topm);

    $dbschema
->SetTableWidth
($tblwidth);

    $dbschema
->Stroke($this->
img,$this->iscale
,$tblposadj);


    $tt
 = new CanvasRectangleText
();

    $tt
->SetFillColor
('');

    $tt
->SetColor('');

    $tt
->SetFontColor
('navy');


    // Add explanation

    $tt
->SetFont(FF_ARIAL,
FS_NORMAL,12);

    $tt
->Set('Project specific tables',$tblwidth+
$leftm+3,16
,15);

    $tt
->Stroke($this->
img,$this->iscale
);


    // Add title

    $tt
->SetColor('');

    $tt
->SetFont(FF_VERDANA,
FS_BOLD,26);

    $tt
->Set('DDDA - DB Schema',9,
0.5,30);

    $tt
->Stroke($this->
img,$this->iscale
);


    // Add a version and date

    $tt
->SetFillColor
('yellow');

    $tt
->SetFont(FF_FONT1,
FS_NORMAL,10);

    $tt
->Set("Generated: ".
date("ymd H:i",time
()),1,$this->
iymax*0.96,15
);

     $tt
->Stroke($this->
img,$this->iscale
);


    $this
->ig->Stroke();

    }

}


$driver
 = new Driver
();

$driver
->Run();


?>