Figure 1: Your first simple Gantt chart. [src]
Sometimes (to save space) the full source is not included in the running text. For example if a new example is just a very minor modification to a previous example. In that case I just show the difference. For all images in this tutorial the full source can always be seen by clicking on the "[src]" tag at the end of the caption for that image.
My hope is that these convention will make it easier to follow the tutorial and will give a balanced mix of full source versus space and ease of reading.
The pragmatic view: To keep management of our back and know what we have forgotten
The common view: As a tool to help identify project issues and highlight problem areas.
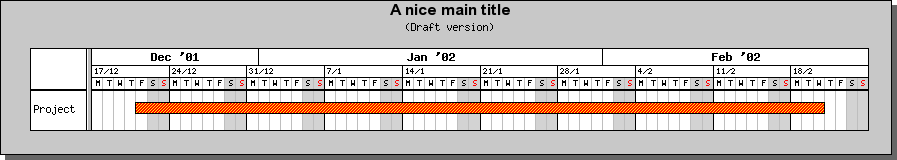
Basically, Gantt charts are used to show the state of a number of activities (possible grouped) against time.
All it takes to do this (using default values for everything) is the following code.
 <?php

include (
"../jpgraph.php");

include ("../jpgraph_gantt.php");


// A new graph with automatic size

$graph =
 new GanttGraph
(0,0,
"auto");


//  A new activity on row '0'

$activity
 = new GanttBar
(0,"Project",
"2001-12-21",
"2002-02-20");

$graph->Add(
$activity);


// Display the Gantt chart

$graph->Stroke();

?>
Let's note a few things with the above image and code:
All that is taken care of in the code below.
 <?php

include (
"../jpgraph.php");

include ("../jpgraph_gantt.php");


$graph =
 new GanttGraph
(0,0,
"auto");

$graph->SetShadow();


// Add title and subtitle

$graph->title->
Set("A nice
 main title");

$graph->title->
SetFont(
FF_ARIAL,
FS_BOLD,12);

$graph->subtitle->
Set("(Draft
 version)");


// Show day, week and month scale

$graph->ShowHeaders(
GANTT_HDAY |
 GANTT_HWEEK |
 GANTT_HMONTH);


// Instead of week number show the
 date for the first day in the week

// on the week scale

$graph->scale->
week->SetStyle(WEEKSTYLE_FIRSTDAY);


// Make the week scale font smaller
 than the default

$graph->scale->
week->SetFont(FF_FONT0
);


// Use the short name of the month
 together with a 2 digit year

// on the month scale

$graph->scale->
month->
SetStyle(
MONTHSTYLE_SHORTNAMEYEAR2);


// Format the bar for the first
 activity

// ($row,$title,$startdate,$enddate)

$activity
 = new GanttBar
(0,"Project",
"2001-12-21",
"2002-02-20");


// Yellow diagonal line pattern on a
 red background

$activity
->SetPattern(BAND_RDIAG,
"yellow");

$activity
->SetFillColor
("red");


// Finally add the bar to the graph

$graph->Add(
$activity);


// ... and display it

$graph->Stroke();

?>
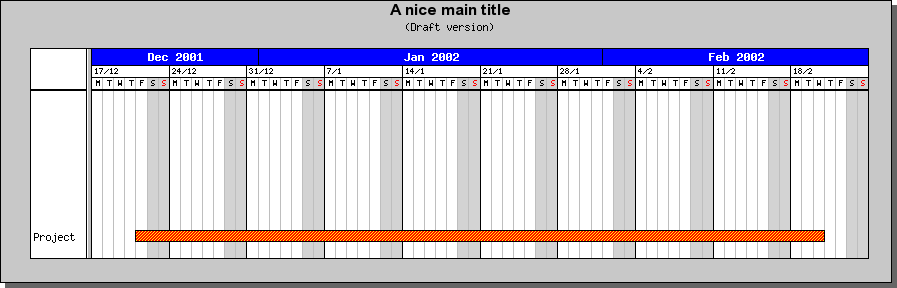
From the above example you might note a few things
 // Use the short name of the month
 together with a 4 digit year

// on the month scale

$graph->scale->month->SetStyle(MONTHSTYLE_SHORTNAMEYEAR4);

$graph->scale->month->SetTextColor("white");

$graph->scale->month->SetBackgroundColor("blue");
to the code above. The resulting image is shown in Figure 3
To create a Gantt chart you add objects to it. As of this writing you may add the following object by the use of the GanttChart::Add() method
 function
 GanttGraph($aWidth,$aHeight,$aCachedName,$aTimeOut,$aInline)
The only real difference is that for GanttCharts you can specify one or both of the dimension parameters (width and height) as -1 in which case that dimension will be automatically sized determined by scale and fonts chosen. The following examples shows some possible ways of creating a new graph
It is perfectly legal, and perhaps even desirable to leave "gaps" when laying out bands to group related activities. So, for example you could have three activities/bars at positions 1,2,3 and then another 2 bars at position 6,7 leaving band 0,4,5 empty.
All these "invisible bands" have the same height (equspaced). The height of each band is automatically determined and depends on both the method of layout ( as specified by (GanttChart::SetLayout()) and the individual heights of the individual bars and titles. The rules are quite simple:
 function
 GanttBar($aVPos,$aTitle,$aStart,$aEnd,$aCaption,$aHeight)
<?php $aVPos | The vertical position for the bar, [0..n] | |
<?php $aTitle | Title for the activity | |
<?php $aStart | Start date for the activity given as string, e.g "2001-09-22" | |
<?php $aEnd | End date for activity given as either a date (a string) or as the duration (in days) of the activity, e.g both "2001-10-15" and 20.5 are valid inputs | |
<?php $aCaption | Text string (caption) to appear at the end (right side) of the bar | |
<?php $aHeight | Height of bar given as either a value in range [0,1] in which case this is interpretated as what fraction of the vertical position should the bar occupy. The height can also be given in absolute pixels [1..200] |
Using our previous example we will illustrate this parameter by
changing the position of our 'Project' activity to position 7. Therefor
we change the call to GanttBar() to
 $activity = new
 GanttBar(7,"Project","2001-12-21","2002-02-20");
and we then get the chart as shown below in Figure 4.
Note that the height of each position (vertical position) will depend on the actual height of the bar.
Specifying the end position may be done in two different ways, either by the end date in the same way as for the start date. The other way is to specify the length of the activity in number of days (and fractions thereof). Examples of valid end dates are:
The full signature for milestones are
 function
 MileStone($aVPos,$aTitle,$aDate,$aCaption)
<?php $aVPos | The vertical position for the bar, [0..n] | |
<?php $aTitle | Title for the activity | |
<?php $aDate | Date for the milestone | |
<?php $aCaption | Text to the right of the milestone |
 $milestone = new MileStone(3,"Code
 complete","2001-12-01");
 $milestone = new MileStone(3,"Code
complete","2001-12-01","(2001-12-01)"); To change the shape of a milestone to, say a triangle, you use the
SetType() method as in
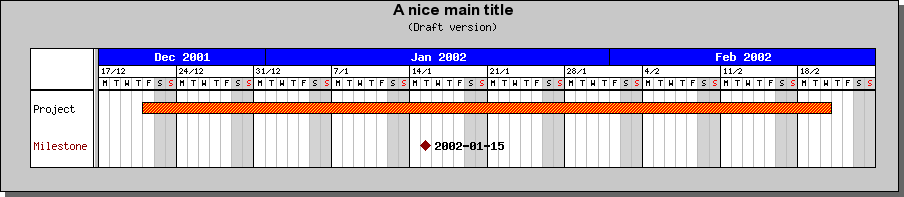
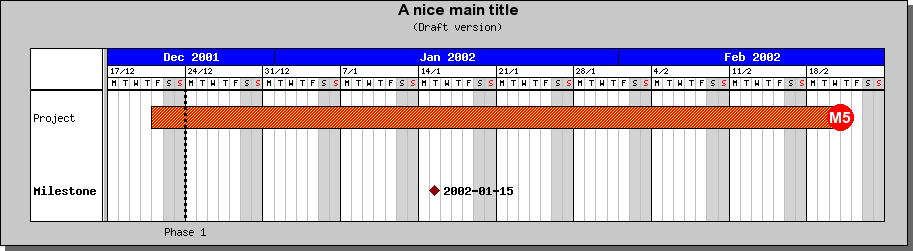
$milestone->mark->SetType(MARK_DTRIANGLE)Let's put this into practice and add a milestone to our previous example by adding the following two lines of code which result in Figure 5 shown below.
You may note that by default the title color is red for milestones.
If you like to change this to be instead, say bold black, you would
invoke the SetColor() and SetFont() methods on the title property of
milestones as in
 $milestone->title->SetFont(FF_FONT1,FF_BOLD);

$milestone->title->SetColor("black");
and thew result would now (not surprisingly be)
To modify the caption you do exactly the same but act on property
'caption' instead of 'title', i.e.
 $milestone->caption->SetFont(FF_FONT1,FF_BOLD);

$milestone->caption->SetColor("black");
It is worth noting that you modify the bar title and caption the exact same way by acting on the 'title' and 'caption' property for the bars.
The full signature for GanttVLine() is
 function
 GanttVLine($aDate,$aTitle,$aColor,$aWeight,$aStyle)
<?php $aDate | Date for the milestone | |
<?php $aTitle | Title for the line. The title is displayed at the bottom of the line | |
<?php $aColor | Color for the line | |
<?php $aWeight | Line width | |
<?php $aStyle | Line style,"dashed", "dotted" and so on |
$vline = new GanttVLine("2001-12-24");
$vline = new GanttVLine("2001-12-24","Phase 1");
 $vline = new GanttVLine("2001-12-24","Phase
 1","darkred");
 $vline = new GanttVLine("2001-12-24","Phase
 1","darkred",5);
 $vline = new GanttVLine("2001-12-24","Phase
1","darkred",5,"dotted"); $vline = new
GanttVLine("2001-12-24","Phase 1");
$graph->Add($vline);
and the example (See 7) now becomes
From the above figure you can see that by default the line is drawn at the beginning of the day of the specified date and in a 'dashed' style. This can (of course!) be modified so that the line is drawn/aligned anywhere in the specified day. You modify this by invoking the method SetDayOffset() with an argument specifying the fraction of the day where you want the line positioned.
If you, for example, want to display the line in the middle of the
day just add the line
$vline->SetDayOffset(0.5);
to the previous code and the result will be
As usual you may modify the font, size and color by invoking the appropriate method (SetFont(), SetColor()) on the 'title' property of lines.
The left and right markers are accessed through the two properties 'leftMark' and 'rightMark'. They are both instances of the general 'PlotMark' class which is also used for the milestones (and in line graphs). The 'PlotMark' class supports several different styles, for example, diamond (the default for milestones), filled and unfilled circles, squares, stares, and so on. Please refer to the reference section for a complete listing.
Let's illustrate this by adding a right marker to the previous
example. We will use a style of a filled (red) circle with a white
title, say, "M5". In order to accomplish this we must augment the
previous example with the following lines:
$activity->rightMark->Show();
$activity->rightMark->title->Set("M5");
$activity->rightMark->SetType(MARK_FILLEDCIRCLE);
$activity->rightMark->SetWidth(10);
$activity->rightMark->SetColor("red");
$activity->rightMark->SetFillColor("red");
$activity->rightMark->title->SetFont(FF_ARIAL,FS_BOLD,12);
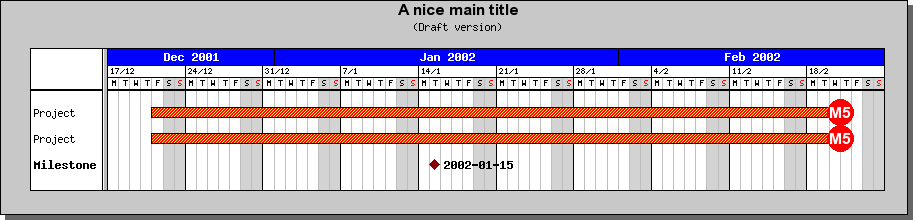
$activity->rightMark->title->SetColor("white");This might seem like a lot of lines but this is as complicated as it possible can get. As an illustration I have changed more or less everything that is changeable. I changed the default font, font-color, fill-color, frame-color and width of marker. The two lines only really necessary are the first two, showing the mark and setting a title. You could get away with using default values for the rest of the properties.
The resulting image can be seen in Figure 9 below.
I have deliberately introduced a "strangeness" here. If you compare the two previous examples you can see that the last example is larger than the previous one. Why?
The explanation is simple if you remember that the height of bars are sized relative to the horizontal spacing. The horizontal spacing are based on the highest single bar including title size and, here come the explanation, marker size. The horizontal spacing has grown since the minimum height is now based on 10 points(=the height of the mark). The bar still occupy the same percentage of the height so it seems to have grown.
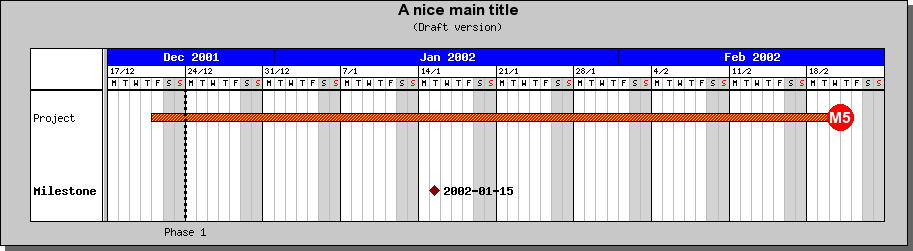
If this behavior is unwanted it is always possible to specify an
absolute size for the bar heigh, say 8 pixels, with a call
$activity->SetHeight(8);
and achieve the result in Figure 10 below.
It is worth noting that the height reserved for each bar is still the same since we haven't changed the height of the marker and the reserved space is the maximum height used by any bar.
 $activity->SetHeight(1.0);

$activity2->SetHeight(1.0);
to the previous example. (Note that a value in the range [0..1] is interpretated as the fraction of the reserved height while a value > 1 is interpretated as the absolute size in pixels.)
Aha.. What we are trying to do doesn't really make sense. Since we
have specified that the bar will always occupy 100% of the available
reserved with there will be no distance between the bars. So what if we
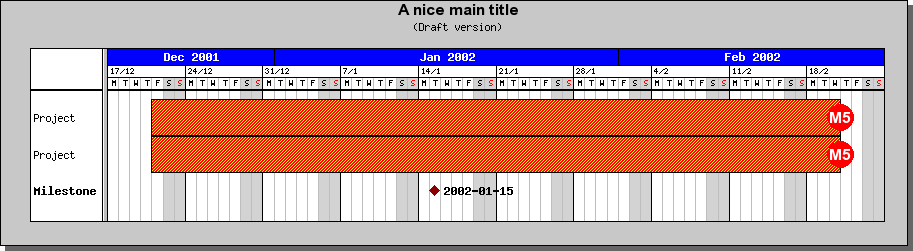
specify the bar as 10 pixel absolute by changing the lines to
 $activity->SetHeight(10);

$activity2->SetHeight(10);
we instead get
So what can we actually do? Well if you remember the reserved height
for each bar is the maximum height of all bars including titles. This
guarantees that no two bars will ever overlap. To guarantee that titles
don't end up too close together there is a Vertical Label Margin
which basically specifies some extra "air" in between the titles. The
amount of air is specified in percent of the title height. To set the
margin you use
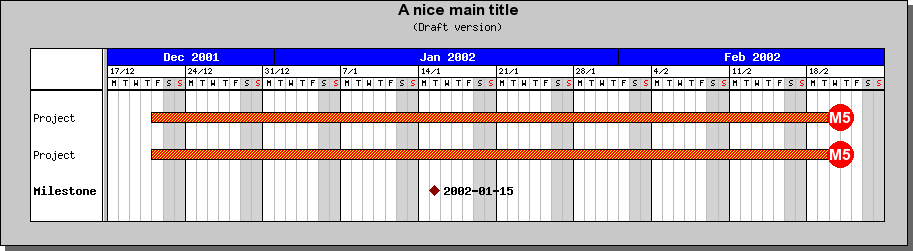
GanttGraph::SetLabelVMarginFactor($aMargin)As an example let's set that margin in the previous example to 0 and see what happens.
As you would perhaps expect the two bars just barely touches now since there are no extra margin added. If the two bars hadn't had the extra right marker it would have looked very compressed.
By default the vertical margin is set to 40%.
 $graph->ShowHeaders( GANTT_HWEEK |
 GANTT_DAY );
If you instead wanted "the big picture" it might be enough to show
year and months by specifying
 $graph->ShowHeaders( GANTT_YEAR |
 GANTT_MONTH );
You can choose freely the combination of scales that you want, but a chart must at least have one scale of course.
Once you have decided what level of details you need you can then fine tune the exact layout/formatting of each of the enabled scales as described below.
These scale header are all accessed through the graph instance
variables 'scale' as in
$graph->scale->week or
$graph->scale->day. All these headers share the following properties.
Show()Determine if the scale should be shown or not
SetFont()Font for text in header
SetFontColor()Specify the color of the header text
SetStyle()Specify what date format should be used, for example in the week scale it is possible to show either week number, the start date of the week and so on.
SetBackgroundColor()As it says, the background color for the header
SetFrameWeight()The line weight of the box around the scale
SetFrameColor()The line color for the frame
SetTitleVertMargin()The margin, in percent, below and above the title text
$graph->scale->week->grid->SetColor("red");Each of the scales also have some specific formatting possibilities as described below.
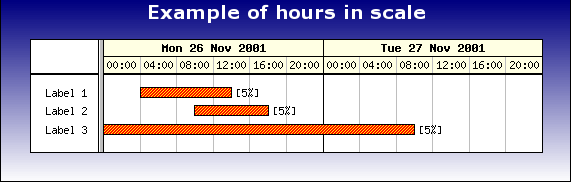
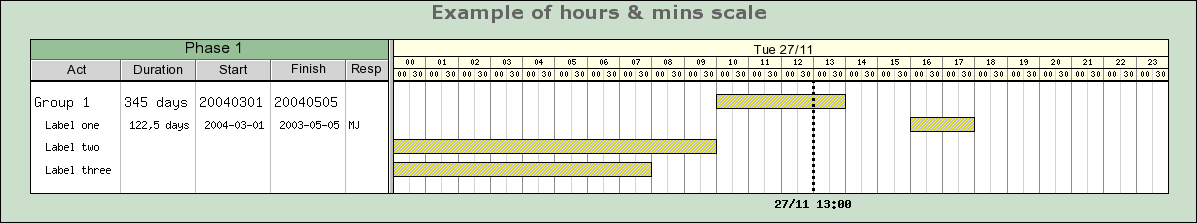
 $graph->ShowHeaders(GANTT_HDAY |
 GANTT_HHOUR | GANTT_HMIN);
The code snippet below shows how to set up a minute scale with 30
min interval and some custom colors.
 $graph->scale->minute->SetIntervall(30);

$graph->scale->minute->SetBackgroundColor('lightyellow:1.5');

$graph->scale->minute->SetFont(FF_FONT0);

$graph->scale->minute->SetStyle(MINUTESTYLE_MM);

$graph->scale->minute->grid->SetColor('lightgray');
The code snippet below shows hot to set up a hour scale to with 45
minutes interval and some custom colors
 $graph->scale->hour->SetBackgroundColor('lightyellow:1.5');

$graph->scale->hour->SetFont(FF_FONT1);

$graph->scale->hour->SetStyle(HOURSTYLE_HMAMPM);

$graph->scale->hour->SetIntervall("0:45");
The example below shows a gantt chart with the day and hour scale enabled
SetWeekendColor()Set the background color for weekends. (Defaults to light gray)
SetSundayFontColor()The Sunday font color. (Defaults to red)
UseWeekendBackground() of the scale, e.g.
$graph->scale->UseWeekendBackground(false);It might be worth pointing out here that the week number calculation is carried out within JpGraph and does not rely on the underlying OS date libraries. This makes the behavior consistent over several OS:s (at least M$ Windows does not comply to ISO-8601 or supply any way of doing this through the normal libraries, e.g. strftime())
You may modify the week behavior in three ways. You can specify (with SetStyle()) a different date format using the constants
WEEKSTYLE_WNBR Show week number To further modify the formatting of the actual week
number you can optionally supply a format string with a call to
SetLabelFormatString()The format of the string should be a standard sprintf() syntax expecting an integer (the week number). By default a 'W' is prefixed to the number.
WEEKSTYLE_FIRSTDAYShow date of first day in week.
MONTHSTYLE_SHORTNAMEDisplay the month name in its locale specific short form, i.e Jan, Feb etc
MONTHSTYLE_SHORTNAMEYEAR2Display the month name in its locale specific short form together with a 2 digit year , i.e Jan '01, Feb '01 etc
MONTHSTYLE_SHORTNAMEYEAR4Display the month name in its locale specific short form together with a 4 digit year , i.e Jan 2001, Feb 2001 etc
MONTHSTYLE_LONGNAMEDisplay the month name in its locale specific long name, i.e. January, February
MONTHSTYLE_LONGNAMEYEAR2Display the month name in its locale specific long name together with a 2 digit year , i.e January '01, February '01 etc
MONTHSTYLE_LONGNAMEYEAR4Display the month name in its locale specific long name together with a 4 digit year , i.e January 2001, February 2001 etc
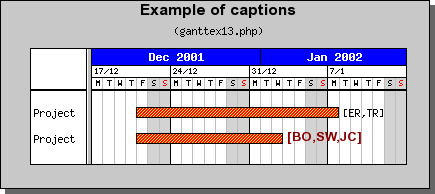
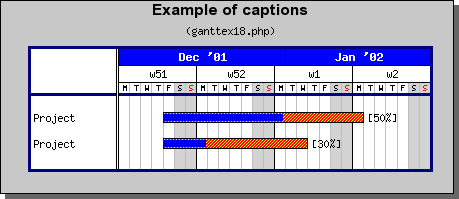
Caption text for a bar is specified either when creating a bar or
later by accessing the 'caption' property of bars. So the two lines
 $activity = new GanttBar(0,"Activity
 1","2001-11-21","2001-12-20","[BS,ER]")
and
$activity->caption->Set("[BS,ER]");
are both ways of specifying the caption "[BS,ER]" for the activity.
Since activity is a standard JpGraph text object you can easily modify
font, color and size with calls to SetFont() and SetColor(), (e.g.
$activity->caption->SetFont(FF_ARIAL,FF_BOLD,9);The figure below illustrates the use of caption
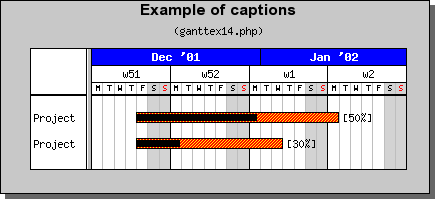
The properties for the progress indicator are accessed through the 'progress' property and it's methods.
To set the progress for a specific activity you only specify the
percent as a fraction. As in
$activity->progress->Set(0.4)
In Figure 16 the previous example is modified to indicate the progress of each activity by the default progress indicator. A solid bar. To make it clearer I have also modified the caption to reflect the displayed progress. (At the same time I slightly modified the scale headers just for fun).
To specify a different format for the progress you use the
SetPattern() method as in
$activity->progress->SetPattern(BAND_RDIAG,"blue");In the reference section you can see the exact parameters and all available methods.
So to get the effect we want for a group bar we have to use the two
lines:
 $groupbar->leftMark->SetType("MARK_LEFTTRIANGLE");

$groupbar->rightMark->SetType("MARK_RIGHTTRIANGLE")
As of the current version There is not yet any formatting support to accomplish the effect of indentation for the titles so this is accomplished by using a fixed width font and adding spaces in front of the title.
First out is an example to help visualize what we will achieve
To use multiple columns there is two steps. First you need to set the titles (name, color, fonts etc). Thereafter you need to add the title columns for each individual bar.
To set the columns you will have to work with the Activity
information property of the scale. The following code excerpt show
this
 $graph->scale->actinfo->SetColTitles(


    array('Note','Task','Duration','Start','Finish'),array(30,100));
You will notice two things. We fist specify the titles using an array. We have also specified a second array with the numbers 30 and 100. This is an optional array that specifies the minimum width of, in this case, the first two columns. By default the columns will be wide enough to hold the widesat text string in the column. However for esthetic reasons you might sometimes want to increase the minium width. This is what we have done here for the first two columns.
Furthermore you can also adjust the background colors and the style
and colors of the vertical dividing grid lines. In the previous image
we used the lines
 $graph->scale->actinfo->SetBackgroundColor('green:0.5@0.5');

$graph->scale->actinfo->SetFont(FF_ARIAL,FS_NORMAL,10);

$graph->scale->actinfo->vgrid->SetStyle('solid');

$graph->scale->actinfo->vgrid->SetColor('gray');
The style for the grid lines can also be "dashed", "dotted" or
"longdashed" as in other line formatting contexts within the library.
You can also adjust if you would like the small "3D" effect in the
titles. By default this is enabled. You can easily turn this of with a
call to
$graph->scale->actinfo->SetStyle(ACTINFO_2D);To adjust the colors of the vertical dividing lines in the title the method SetColor() is used as in "$graph->scale->actinfo->SetColor('navy');".
The second thins is to actually populate the columns. This is done (of course) as you add the activity bars to the graph. Previous we just used a string as the title when we wasn't using columns. By simply replacing this string with an array we specify the content of the columns.
For example to specify two column titles we just create a hypothetical Gantt bar as In the full example above we put all this in arrays to make for better coding practice since we create several bars.
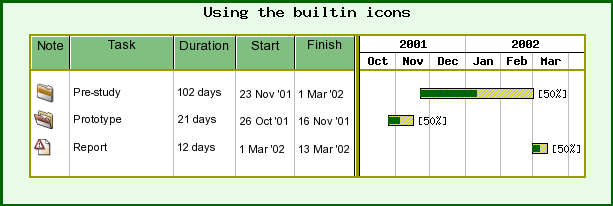
In addition to ordinary text you can also add an image or any of the
predefined icons available. In order to add that in a column you first
create an instance of IconImage() and then specify that instance
instead of the text. So in the previous code snippet if we wanted a
"open folder" image in the first column we would change the lines to
 $iconopen = new
 IconImage(GICON_FOLDEROPEN,0.6);

$title2="";

$bar = new
 GanttBar(0,array($iconopen,$title2),"2003-11-23","2003-12-05");
The available builtin icons are
$myicon = IconImage('myicon.png');
If you wonder, the second argument in the IconImage() call is an optional scaling factor which you can use to adjust the size of the image.
 $graph->scale->tableTitle->Set('Phase
 1');

$graph->scale->tableTitle->SetFont(FF_ARIAL,FS_NORMAL,12);

$graph->scale->SetTableTitleBackground('darkgreen@0.6');

$graph->scale->tableTitle->Show(true);
A full example of this is shown below
 $bar->title->SetCSIMTarget(array('sometarget1.html','sometarget1.html'),
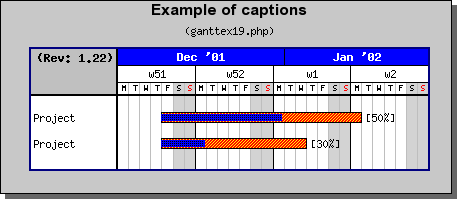
array('alttext1','alttext2')); $graph->scale->tableTitle->Set("(Rev:
1.22)");
$graph->scale->tableTitle->SetFont(FF_FONT1,FS_BOLD);
$graph->scale->SetTableTitleBackground("silver");
$graph->scale->tableTitle->Show();The example lines above also changes the default white background to silver. Adding these lines to the previous example gives the following result:
From the above example you might notice that the width of the left column (which holds all the titles) have automatically adjusted itself to make the table title fit.
 $graph->scale->divider->SetWeight(3);

$graph->scale->divider->SetColor("navy");

$graph->scale->dividerh->SetWeight(3);

$graph->scale->dividerh->SetColor("navy");
The effect of this is shown in Figure 21 below
$graph->SetBox(true,"navy",3)
which will result in a thicker plot box around the area as shown below
Note: You might notice the slight discrepancy in design that here you use a method and in the previous cases accessed a property which you modified. This is the unfortunate affect of over a years development of JpGraph. My own design preference has simply changed over time. For revision 2.x I plan on taking the opportunity to make things like this more conform since I have now convinced myself that this is a better design.
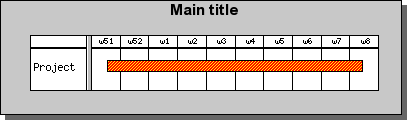
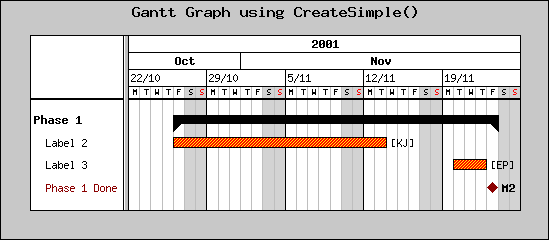
Now when you have a basic understanding of how this works you are ready to appreciate a small helper method. GanttGraph::CreateSimple(). This method takes a few arrays of data which specifies you Gantt chart and then constructs this chart. By using this method you sacrifices a few adjustment possibilities for simplicity. This method is nothing magical it just takes the data for the activities,(start and end date, titles, progress, any constrains and so on) and constructs the activities and adds them to the graph.
The activities are specified in data array which for each activity have the following fields
So for example to create a Gantt chart consisting of two activities which are grouped and a milestone one would have to use something similar to the following code
 $data = array(

  array(0,ACTYPE_GROUP,    "Phase
 1",        "2001-10-26","2001-11-23",""),

  array(1,ACTYPE_NORMAL,   "  Label
 2",      "2001-10-26","2001-11-13","[KJ]"),

  array(2,ACTYPE_NORMAL,   "  Label
 3",      "2001-11-20","2001-11-22","[EP]"),

  array(3,ACTYPE_MILESTONE,"  Phase 1 Done", "2001-11-23","M2") );


// Create the basic graph

$graph = new GanttGraph();

$graph->title->Set("Gantt Graph using CreateSimple()");


// Setup scale

$graph->ShowHeaders(GANTT_HYEAR | GANTT_HMONTH | GANTT_HDAY |
 GANTT_HWEEK);

$graph->scale->week->SetStyle(WEEKSTYLE_FIRSTDAY);


// Add the specified activities

$graph->CreateSimple($data);


// .. and stroke the graph

$graph->Stroke();
This will then show up as
You may (slightly) modify the appearance of the simple Gantt charts by means of the methods GanttGraph::SetSimpleFont() and GanttGraph::SetSimpleStyle() But not anything else, remember that the purpose with this way of constructing graphs is to be simple. If you need full advanced control you have to construct all the activities in the "normal" way.
You can also specify constrains and progress for each bar by supplying additional data arrays to GanttGraph::CreateSimple().
You specify the target and the associated "Alt" text for an activity bar by calling the GanttBar::SetCSIMTarget() and GanttBar::SetCSIMAlt()
In a similar way you set the target and Alt texts for the activity
title as the following code extract shows.
 $bar->SetCSIMTarget("http://localhost/abc/");

$bar->SetCSIMAlt("Alt Text for the bar");

$bar->title->SetCSIMTarget("http://localhost/abc");

$bar->title->SetCSIMAlt("Alt Text for the title");
The above code assumes that your activity is available in the variable 'bar'. In the example directory there is a complete example of how to use CSIM together with Gantt charts in the "ganttcsimex1.php" file. (Please note that this example makes use of the simplified Gantt chart specification using the CreateSimple() method.
JpGraph support visualizing the following types of constrains
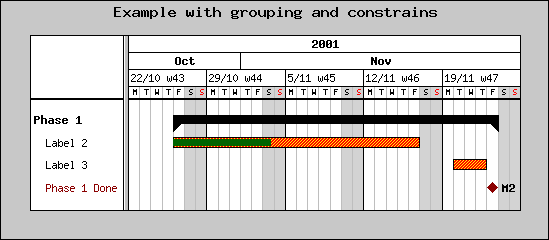
Assume that we start with the Gantt schema as illustrated below
We would now like to add the constrains that the activity "Label 3" cant start before activity "Label 2" has finished and that the milestone "Phase 1 done" is depending on when activity "Label 3" is done.
The principle of adding constrains is that you for each activity you want to have a constrain you have to tell to what other activity this constrain should be to. That other activity is specified by telling on what row that activity lies. Depending on what type of constrain, e.g. Start-to-End, an arrow will now connect the two activities in correct way.
The way to do this is to call the SetConstrain() method on the activity. In this method you specify the type of constrain as well as to what other activity this constrain should be to. If you read the class reference you can also see that you can specify the type and size of arrow used. For now we will just use the default sizes and type.
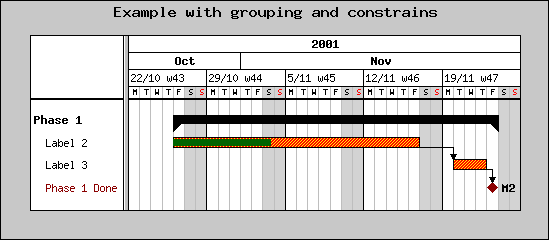
So for example to add an End-To-Start constrain between "Label 2"
and "Label 3" you could write
$bar2->SetConstrain(2,CONSTRAIN_ENDSTART)The first parameter in the call above "2" is the row of the target activity (i.e. the row where "Label 3") activity is. In the example below we have added the constrains we wanted.
A note: The actual path followed by the arrow is controlled by some heuristics to make it clear what the constrain is. It has been a design decision that in order to keep the API simple the user has no further detailed controlled on the actual path followed. However, in future version the heuristics may be extended and provide some user-controllable parameters.
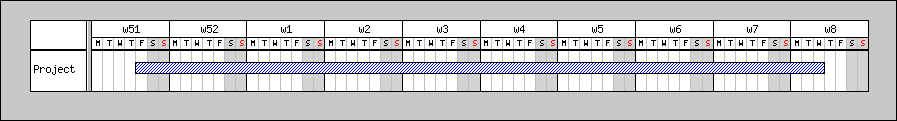
$graph->SetDateRange("2001-12-20","2002-01-20");will show the part of the Gantt chart between the 20 Dec 2001 and 20 of January 2002. Please note that the format depends on the locale setting.
To specifically set a locale you specify the wanted locale with a
locale string (ala standard PHP), for example American English is
specified with the string 'EN_US', British English with 'EN_UK' 'nl_NL'
for Dutch and so on. If your current installation does not support the
specified locale an error message will be given.
$graph->scale->SetDateLocale("se_SE");
The result is displayed below.