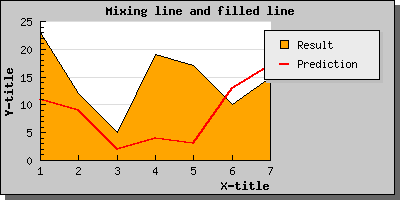
Figure 1: Mixing filled and non-filled line plots in the same graph [src]
To start simple we just mix a filled line plot with a non-filled line plot as the following example shows.
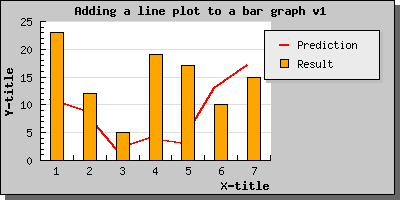
Let's now go to something a little bit more complicated. How to mix bar and line graphs. Let's just take one of our previous bar graphs and add a line plot to it and see what happens.
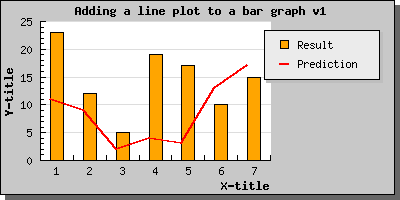
Not too bad. But we can't see the line so we change the order in which we add the lines to the graph and sees what happens.
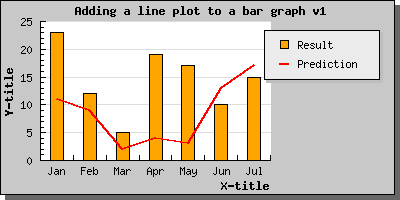
If you want the line points to be aligned in the center of the bars you can accomplish this is two ways.
If you use a text scale then you need to call the LinePlot::SetBarCenter()
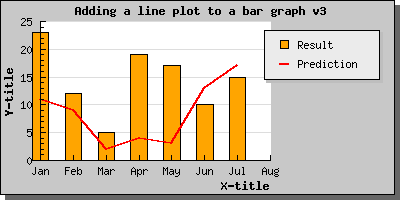
You can also use an integer scale. This places both the bar and the line points centered at the tick marks. As the following example will show
Note: In this example we also have illustrated the fact that you can add text labels to a linear (or integer) scales as well.
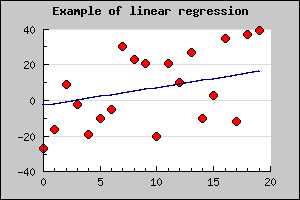
As a final example we show how you can combine a scatter plot and a line plot which could be used to illustrate a regression line fitting.