Contents
Previous
Next
JpGraph offers two variation on what is usually known as stock charts,
candle-charts or box plot.
Stock charts is used to display data values where one is interested in
4 different values for each data point. This could for example be used
to display a stock's open,close, min and max value during a specific
day. Hence the name Stock chart (or Stock plot).
The figure below illustrates a sample Stock chart plot
 Figure 1: A simple stock plot
[src]
Figure 1: A simple stock plot
[src]
For this type of plot the Y-data array must be consist of a number
of quadruples of data where each quadruple consists of
(open,close,min,max). The open and close values determine the min max
for the middle bar and the min,max determine the end points of the
"error-lines" at the top and bottom of of each bar.
Note that the data follows the following rules
- min < max
- min < min(open.close)
- max > max(open,close)
To separate the two cases where "open > close" or "open < close "
different colors are used. These colors are specified with the
SetColor() method. By default a positive bar (close > open) have a
fill color of white and for the negative case where (close < open) the
bars have a red color.
You can specify the width of the bar by setting the width (in
pixels) with a call to the method
SetWidth()
The final variation of stock plots you can have is to determine
whether or not the end point for the min,max lines should have the
horizontal line marking the end of the line or not. This can be
adjusted with a call to method
HideEndLine().
A minor variation of stock charts is the "BoxPlot()" this is almost the
same as StockPlot() but with the very small difference that in addition
to the open,close,min, max values you also specify a median value . The
median lies between the open and close value and is illustrated as a
horizontal line within the bar.
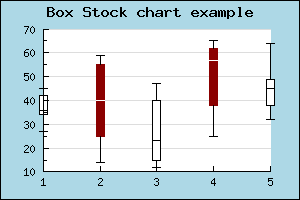 Figure 2: A simple box type stock plot
[src]
Figure 2: A simple box type stock plot
[src]
You may modify the median line color for positive and negative data
points / bars by using the
SetMedianColor() method.
In the same way as for other plots you may associate an image map with
these plots. The "hot" area for each plot is the mid "bar" section. In
the same way as other plot types you use the
SetCSIMTargets() to set the URL's you want to use.
Note: These plot types, though normally used without explicit
X-values, can of course handle a supplied X-coordinate array without
any problem.
Contents
Previous
Next