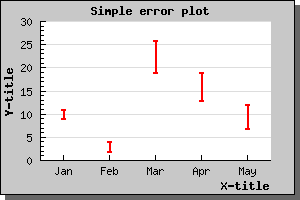
Figure 1: A simple error bar [src]
Before you can use error plots you must remember to include the file "jpgraph_error.php" in your script.
The following example illustrates a simple error bar. We will have 5 points, so we need 10 Y-values. We also would like the error bars to be red and 2 pixels wide. All this is accomplished by creating an ErrorPlot() in much the same way as, for example, a normal line plot. Doing this would now give the example shown below.
You might notice that there is one displeasing aesthetical quality of this graph. The X-scale is just wide enough to just accompany the number of error bars and hence the first bar is drawn on the Y-axis and the and last bar just at the edge of the plot area. To adjust this you might call the SetCenter() method which will adjust the X-scale so it does not use the full width of the X-axis.
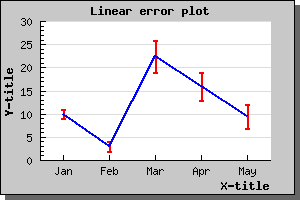
The following example illustrates the use of this feature by applying this technique to the previous example
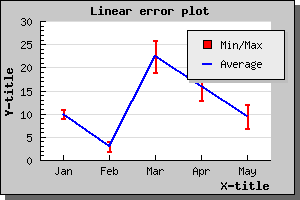
To control the various properties of the line drawn the "line"
property of the error line plot may be accessed. So, for example, if
you want the line to be 2 pixels wide and blue you would have to add
the following two lines
 $elplot->line->SetWeight(2);

$elplot->line->SetColor("blue");
to generate the graph as shown below
You may of course add legends to none, one or both of the line types
in the above graph. So for example if we wanted the legend "Min/Max"
for the red error bars and a legend "Average" for the blue line you
would have to add the lines
 $errplot->SetLegend("Min/Max");

$errplot->line->SetLegend("Average");
The resulting graph will now look like (note that we are using the default placement of the legend box)