Contents
Previous
Next
As an additional way of emphasizing certain areas of the graph it is
possible to add bands (either vertical or horizontal) to any one of the
standard X-Y coordinate system based graphs. A band is a rectangular
area that stretches one entire axis. This means that if you define a
band between X-coordinates 3 and 5 the band area will occupy an area
between the X-coordinates and the entire Y-range.
In order to access this functionality you must first make sure that
you include the additional library file jpgraph_plotband.php
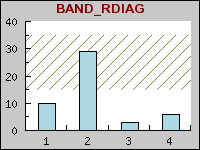
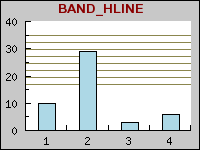
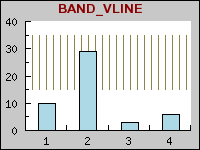
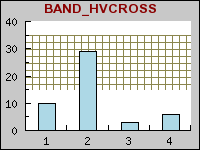
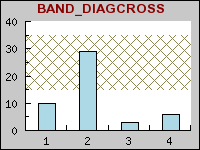
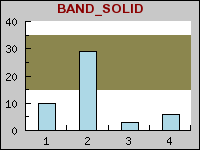
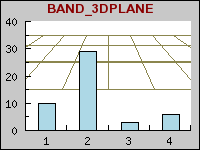
At the time of this writing (current as of JpGraph 1.8) the table
below illustrates the 8 basic types of patterns available. We will
shortly show you how you can customize these patterns, To keep these
examples clear we have only used one pattern in each figure.
To add a one of these patterns to your graph you need to call the
method
PlotBand::PlotBand() The arguments is fairly easy to understand.
The pattern you would like to use is specified by using the correct
constant. You can see the name of the correct constants in the figures
above. You also need to specify if the band should stretch along the
vertical or horizontal axis as well as the min and max coordinates for
the band. As coordinates you may also use the special values "min" and
"max" which automatically sets the value to the minimum/maximum value
of the scale. The specified numeric value will be automatically
truncated to fit within the plot area.
We don't discuss the other arguments further here, instead we refer
you to the class reference.
All patterns can be customized by
- ... altering the colors of the band
- ... altering the density of the patterns using the method
PlotBand::SetDensity() The density is specified as an integer in
range 1 to 100 where a higher number means a higher density (smaller
distance between the lines). For example setting the density of the 3D
plane above to 60 gives the result
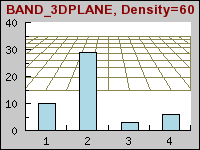 Figure 9: Increasing the desnity in a pattern
[src]
Figure 9: Increasing the desnity in a pattern
[src]
- ... enabling or disabling a frame around the pattern by using the
method
PlotBand::ShowFrame() The band will be given the same color as the
band.
- ... finally you can change whether the band should be drawn on top
of the plots or beneath, (by default the bands are under the plots),
using the
PlotBand::SetOrder() as the following example show
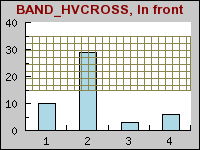 Figure 10: Stroking the pattern on top of the
plots [src]
Figure 10: Stroking the pattern on top of the
plots [src]
Sidenote. 3D planes actually carry another
possible modification. You can specify the vanish point to change the
perspective used. You can't access the method to change the horizon
directly but you can access it through
$band->prect->SetHorizon($aHorizon)
assuming that the band is a 3D plane.
To finish this section we give one final, more creative, example on
how to use the bands.
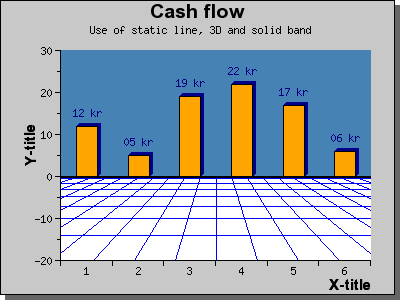 Figure 11: Combining 3D plane, solid band and a
sttaic line [src]
Figure 11: Combining 3D plane, solid band and a
sttaic line [src]
In addition to the bands you can also add static lines to the graph. An
example of that is actually shown in figure 11 above. You create a line
as an instance of class
PlotLine . So for example the lines
 $sline = new
 PlotLine(HORIZONTAL,0,"black",2);

$graph->Add($sline);
will add a 2-pixel wide horizontal static line at Y-position zero.
Contents
Previous
Next